In this exercise, you will use a Word template (DOCX) to export data into charts within the document.
Let's start by creating a cover page as previously learned and inserting a Table of Contents.
This document will iterate multiple issues (Bulk export), exporting some basic information and a chart based on Number Type Custom Fields for each issue.
While iterating all issues, we'll update some template variables (with set function), which will be used to export a final chart at the end of the document.
Insert a title "Issues" with style Heading 1 (to be used with TOC) and below it add the following set functions:
${set(issueTypeBug,0)} ${set(issueTypeStory,0)} ${set(issueTypeSubTestExec,0)} ${set(issueTypeEpic,0)} ${set(statusOpen,0)} ${set(statusResolved,0)} ${set(statusClosed,0)} ${set(statusInProgress,0)} |
Those variables will be used to populate the final chart.
Start iterating issues with &{for issues}.
Export some basic information like the issue Key and Summary.
Insert a chart.
To insert the Microsoft Excel Chart:
- Insert
- Object
- Microsoft Excel Chart
Double-click the newly inserted chart to edit it.
We'll populate the chart with three values: AttachmentsCount, CommentsCount and LinksCount.
Righ click the chart and choose "Select Data". You'll be transferred to the sheet with the data. Select the Range from A1 to D2.
Delete all other data and change the selected range as follows:
| A | B | C | D | |
|---|---|---|---|---|
| 1 | AttachmentsCount | CommentsCount | LinksCount | |
| 2 | ${Key} | ${AttachmentsCount} | ${CommentsCount} | ${LinksCount} |
Now, we'll need to update the previously defined variables. We'll increment each issue type and status depending on the issue context being exported.
#{if (%{'${IssueTypeName}' == 'Bug'})} ${set(issueTypeBug,%{${issueTypeBug} + 1})} #{end} #{if (%{'${IssueTypeName}' == 'Story'})} ${set(issueTypeStory,%{${issueTypeStory} + 1})} #{end} #{if (%{'${IssueTypeName}' == 'Sub Test Execution'})} ${set(issueTypeSubTestExec,%{${issueTypeSubTestExec} + 1})} #{end} #{if (%{'${IssueTypeName}' == 'Epic'})} ${set(issueTypeEpic,%{${issueTypeEpic} + 1})} #{end} #{if (%{'${Status}' == 'Open'})} ${set(statusOpen,%{${statusOpen} + 1})} #{end} #{if (%{'${Status}' == 'In Progress'})} ${set(statusInProgress,%{${statusInProgress} + 1})} #{end} #{if (%{'${Status}' == 'Resolved'})} ${set(statusResolved,%{${statusResolved} + 1})} #{end} #{if (%{'${Status}' == 'Closed'})} ${set(statusClosed,%{${statusClosed} + 1})} #{end} |
Close the issues iteration with &{end}.
Being almost finished, let's add two final charts with the totals of issue types and issue statuses.
Add a title "Totals" with style Heading 1. Insert two charts as before, with the following data:
| A | B | C | D | E | |
|---|---|---|---|---|---|
| 1 | Bug | Story | Sub Test Execution | Epic | |
| 2 | Issue Types | ${issueTypeBug} | ${issueTypeStory} | ${issueTypeSubTestExec} | ${issueTypeEpic} |
| A | B | C | D | E | |
|---|---|---|---|---|---|
| 1 | Open | In Progress | Resolved | Closed | |
| 2 | Issue Statuses | ${statusOpen} | ${statusInProgress} | ${statusResolved} | ${statusClosed} |
And we're done.
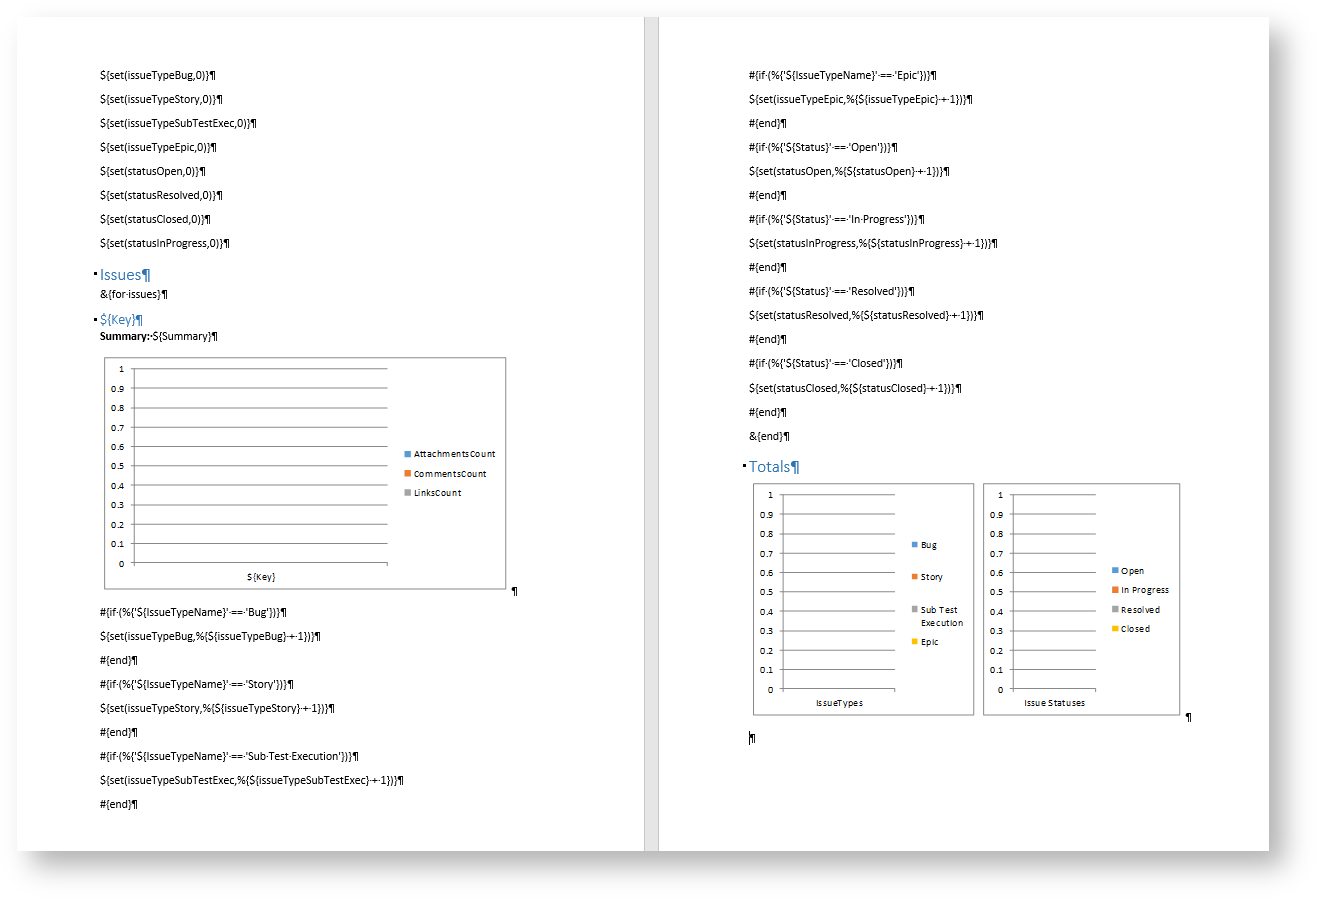
Below there is a sample of how the mappings will be displayed in a Word template:
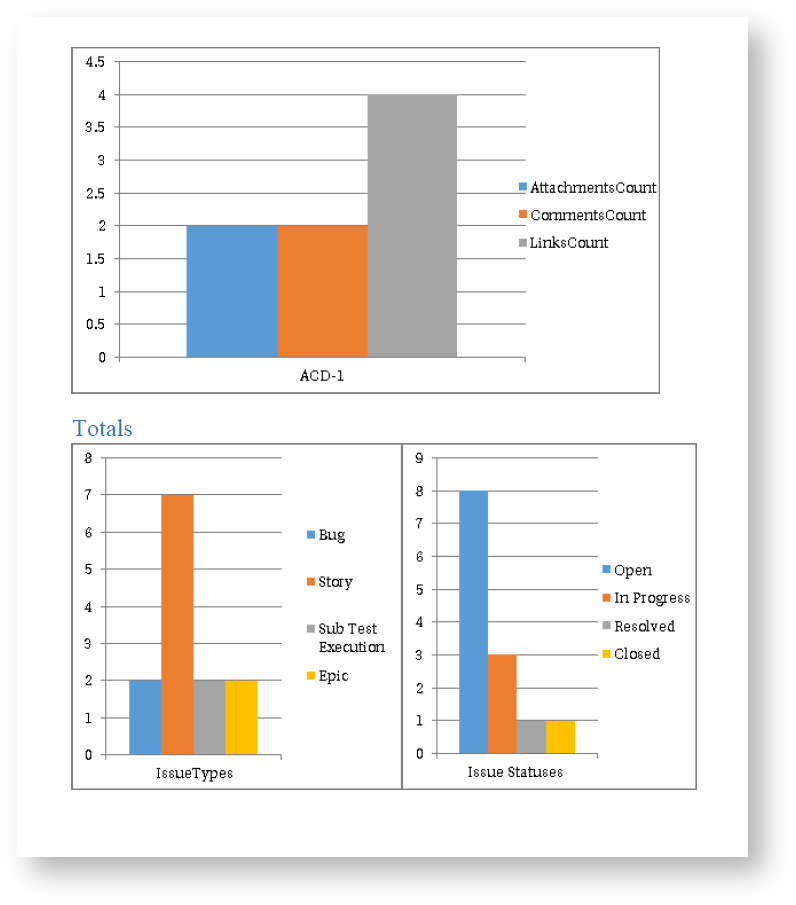
Below there is a sample of how the generated file will be populated:
You can find more examples of charts in MS Word templates in here.
If you like this exercise, please share your opinion on the page by just leaving a comment or a ![]() . Your opinion is very important to us.
. Your opinion is very important to us.
Thank you in advance.
Enjoy our product. ![]()