Problem
Creating Cannot create a chart in a sheet populated by exported data on from a different sheet is not working.
Solution
1
...
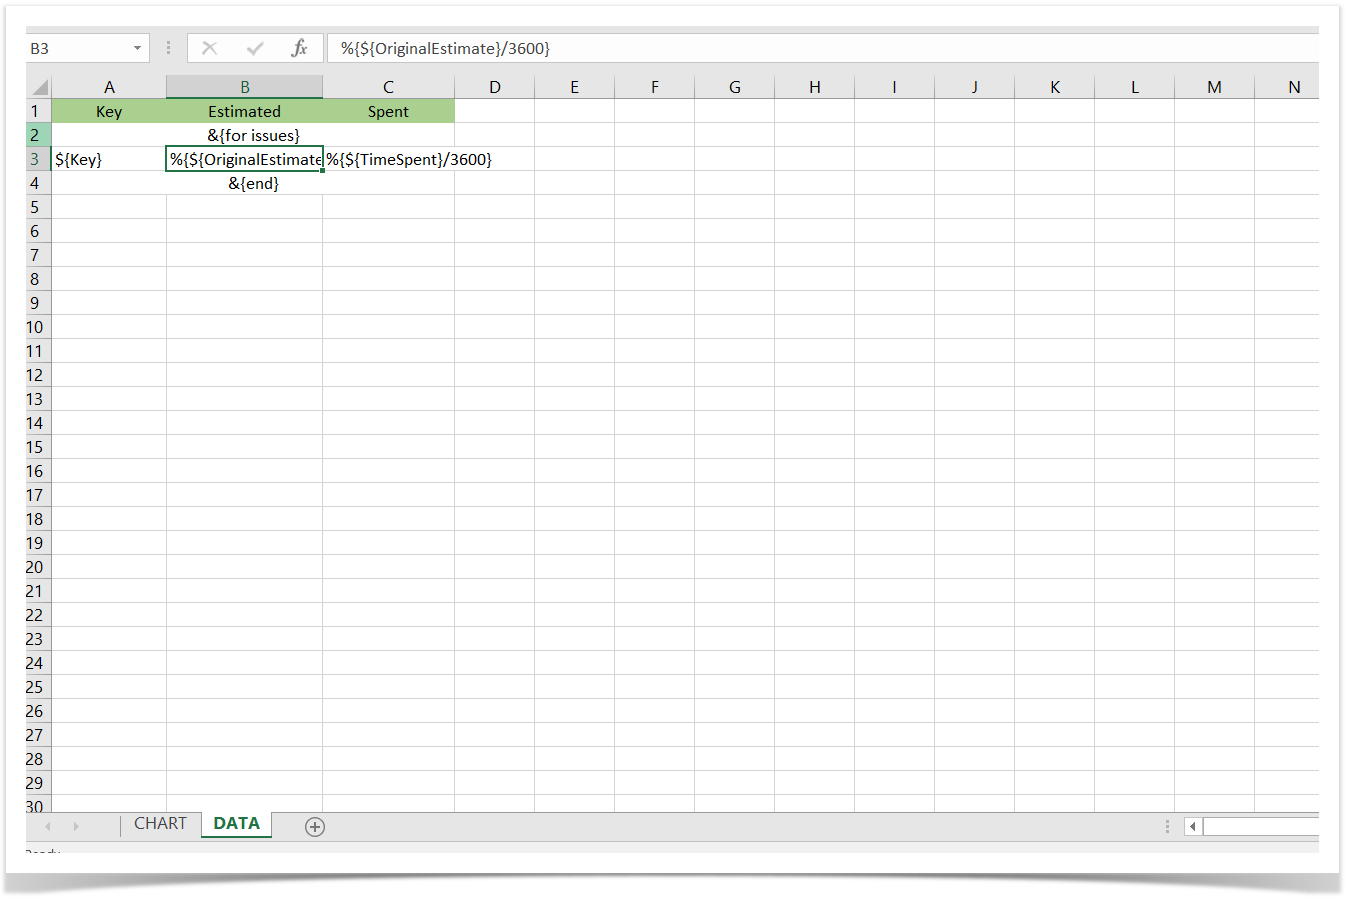
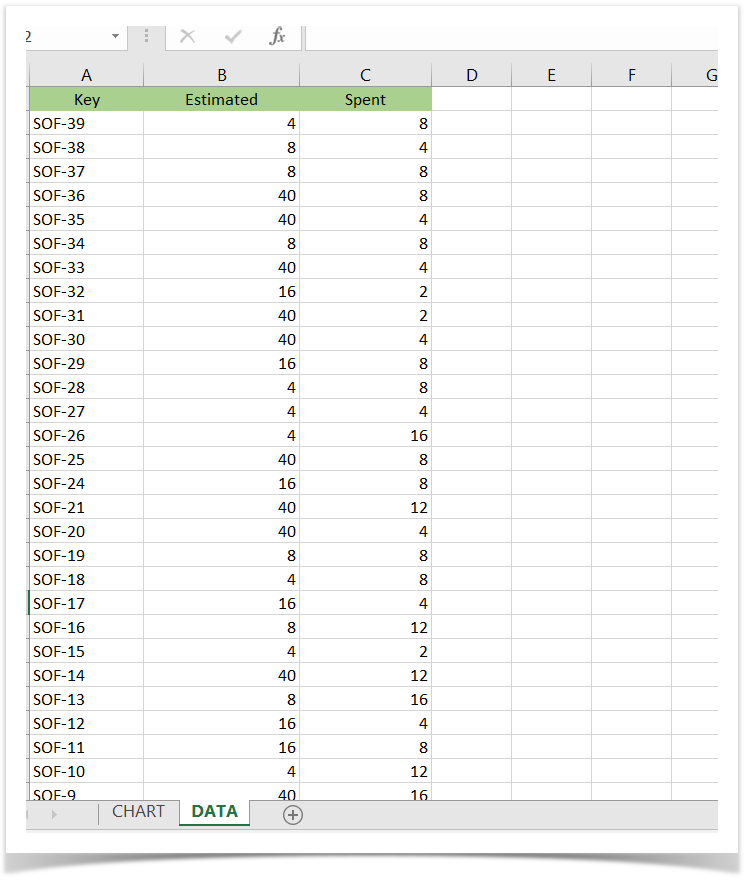
. Create a simple table with column titles to export your data
2
...
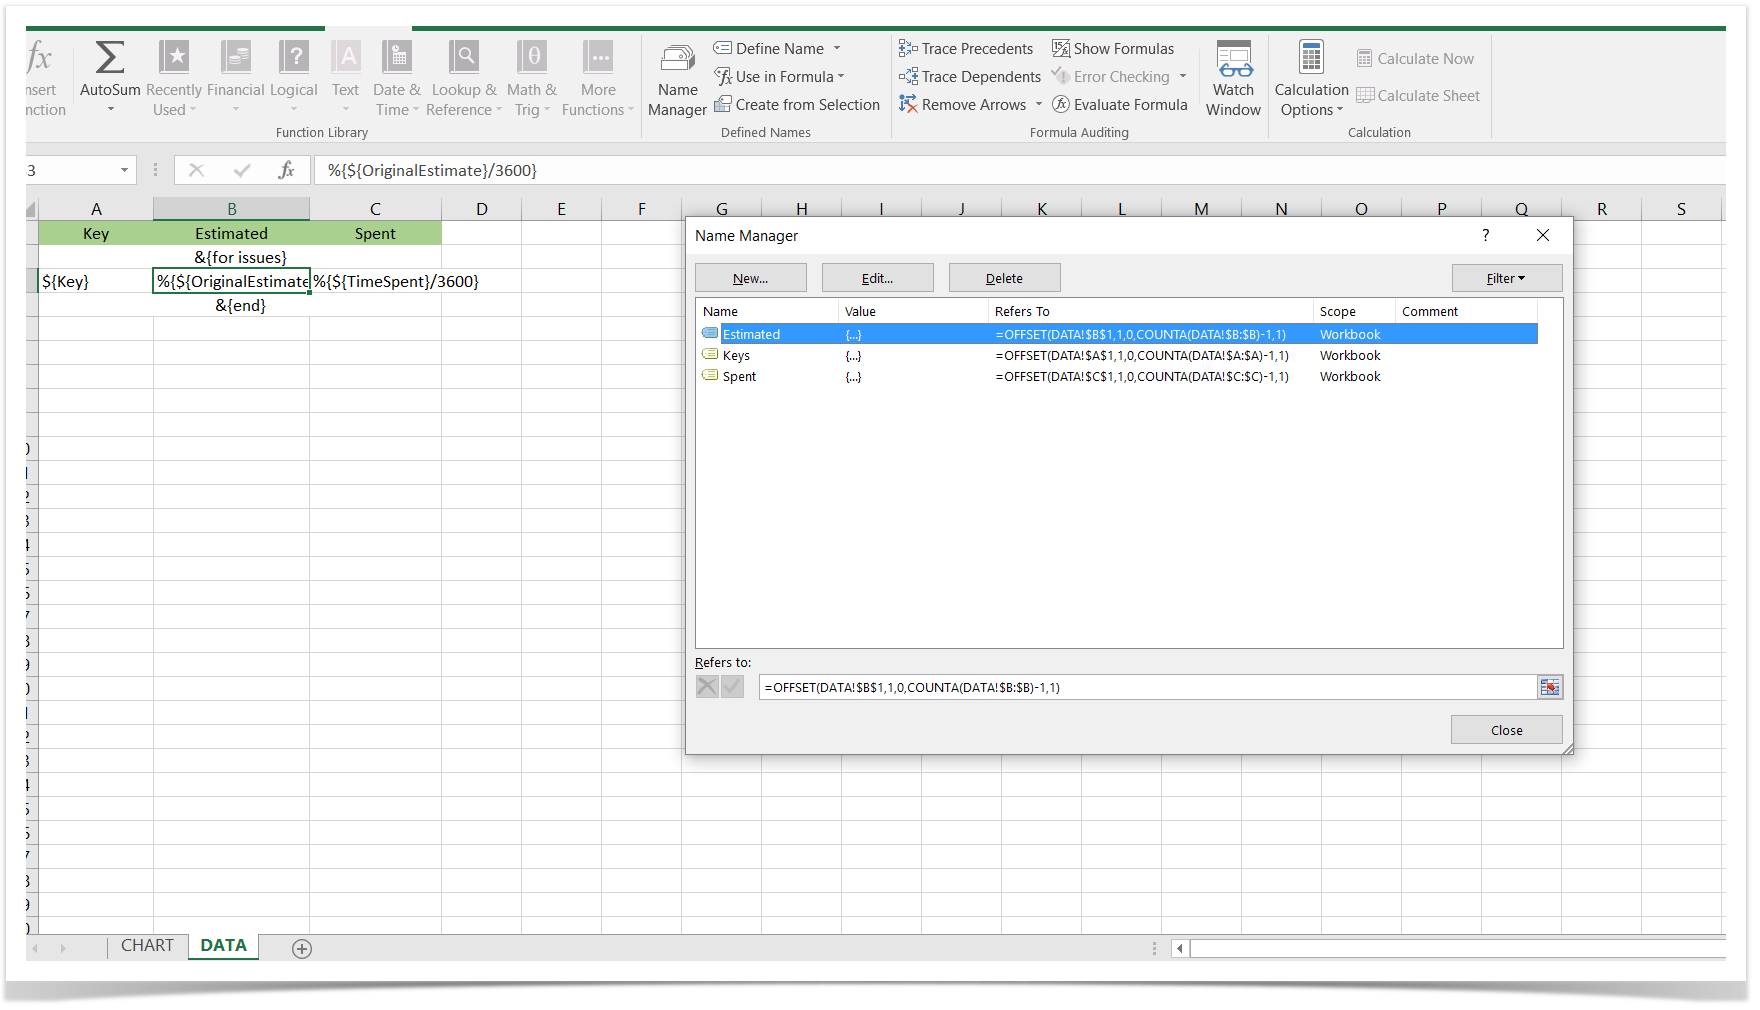
. Create a named formula for each column in your table. This formula will have the following syntax:
=OFFSET(DATA!$A$1,1,0,COUNTA(DATA!$A:$A)-1,1) |
|---|
This formula will create a zone/range that will represent the column with all the exported data.
* DATA!$A$1 -> This represents the starting cell: we'll start on the columnt column title (Sheet 'DATA', Cell A1: 'Key', in this example)
...
* 1 -> Number of columns to define the zone/range (we only want the column we're on)
3
...
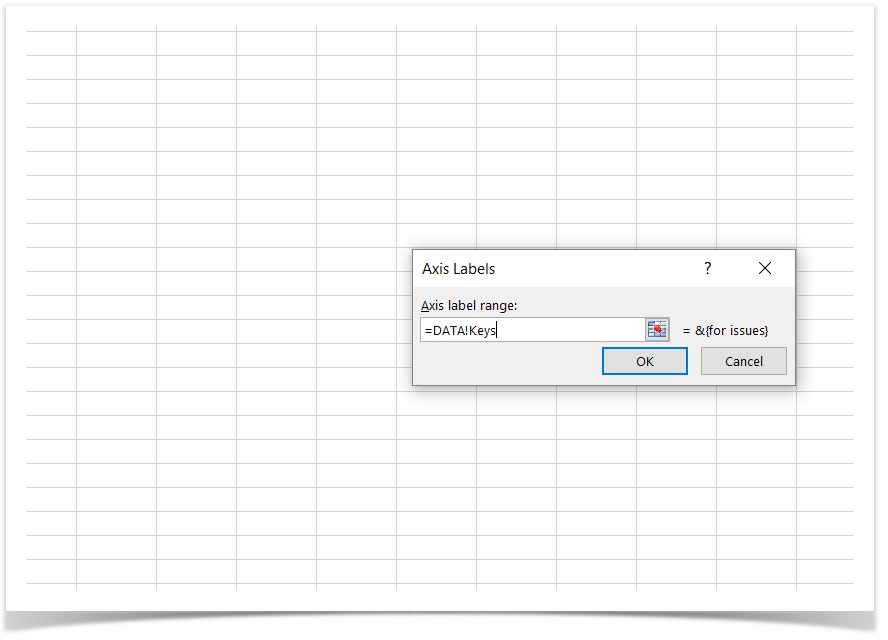
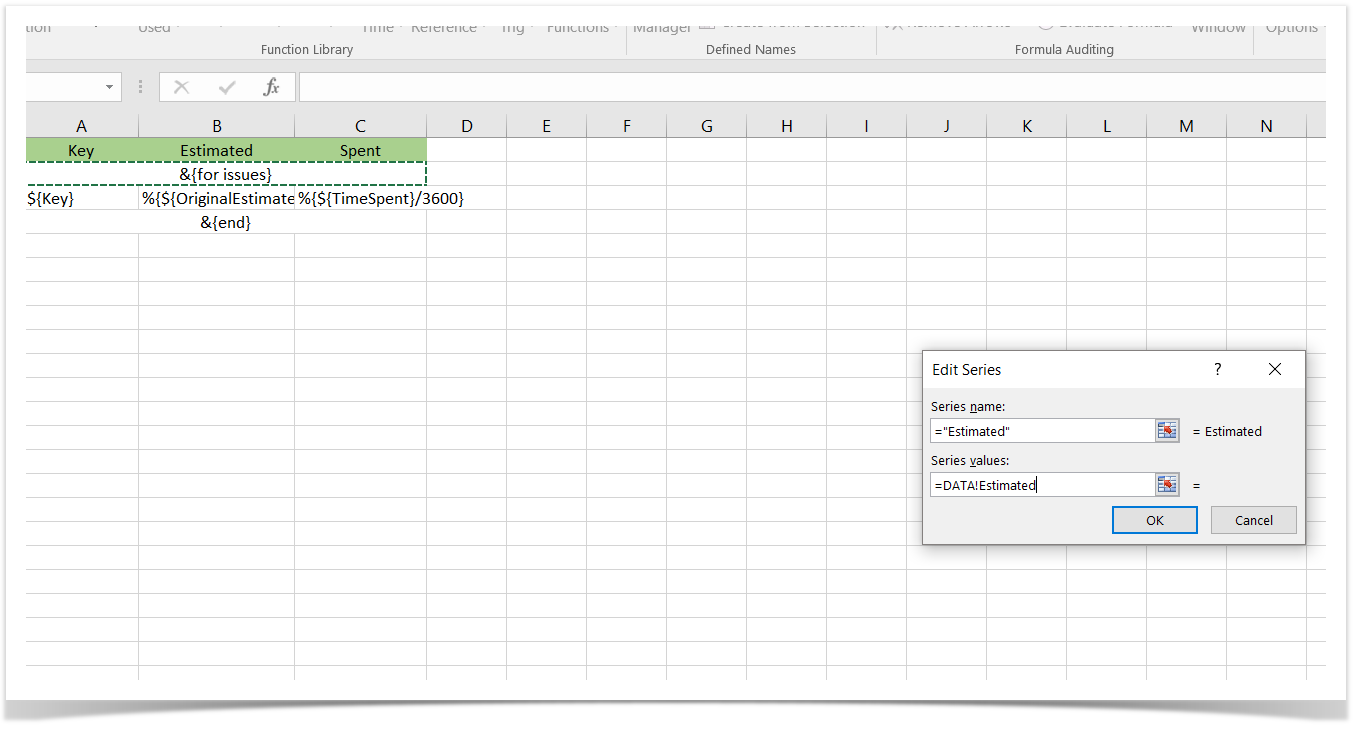
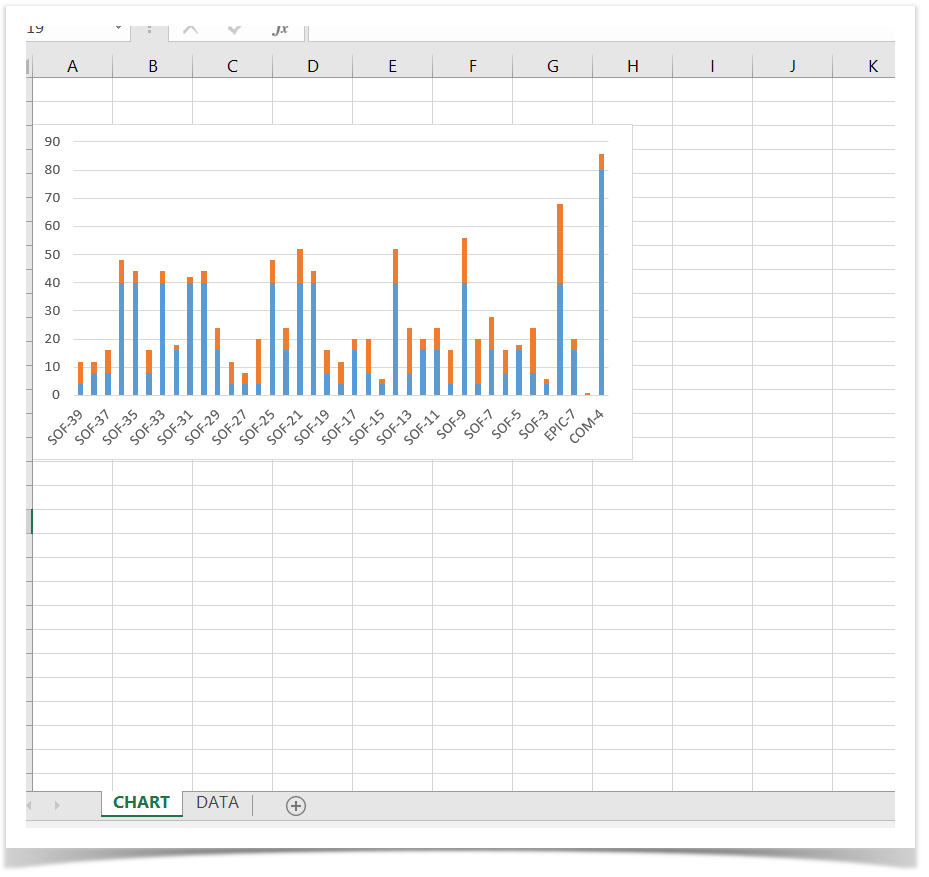
. Create a chart on a different sheet and "Select Data"
* Add a new Series for each column you want to visualize in your chart:
...
* Add a Horizontal (Category)
** =DATA!Keys
4
...
. Save, upload to Xporter for Jira, and then export issues with data.
Jira Reference: | XPORTER-813 |
|---|