...
| Panel |
|---|
| borderColor | #F3F3F3 |
|---|
| bgColor | #FAFAFA |
|---|
| borderWidth | 1px |
|---|
|
| Section |
|---|
Define final report name for Single and Bulk export| Column |
|---|
| This feature will allow you to define a final report name for Single and Bulk export and are available on Xporter issue detail panel and bulk export screen. The file name can resolve mappings as it is being made on workflow post functions (Date, Key...). |
| Column |
|---|
| Issue detail panel
Bulk export screen
|
|
|
| Panel |
|---|
| borderColor | #F3F3F3 |
|---|
| bgColor | #FAFAFA |
|---|
| borderWidth | 1px |
|---|
|
| Section |
|---|
Jira Service Desk integration is now better than ever| Column |
|---|
| This release will allowto exportmore information related to the SLA. Each SLA has information when started, stopped and whether it breached the SLA goal. SLA notation is: ${<SLA custom field>.<Field>} |
|
| Column |
|---|
| Fields availableSLA fields | Description |
|---|
elapsedTime | Returns the total time the SLA has been running | startTime | Returns the date when the SLA started | stopTime | Returns the date when the SLA stopped | goalDuration | Returns the date with the SLA duration | breached | Returns a boolean if the SLA is breached | paused | Returns a boolean if the SLA is paused | withinCalendarHours | Returns a boolean if the SLA is within calendar hours |
|
|
|
| Section |
|---|
| Column |
|---|
Bulk Export and Xporter Reports screen improvedAfter getting some feedback from some customer we've decided to improve our Bulk/Xporter Reports screen. We added a button to download the generated document instead of having a link inside of the success message. See how does it look like. |
| Column |
|---|
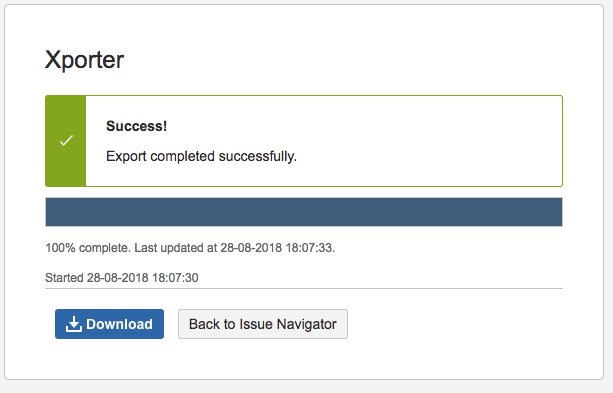 Image Added Image Added
|
|
| Section |
|---|
| Column |
|---|
Xray integration is now faster than everSome changes were done on Test Status, Test Plan Overall Execution Status and Test Execution Overal Execution Status due to some performance problems reported by customers. Here is teh new notation to get the status printed: | Code Block |
|---|
#Overall Execution Status (percentage + total of testes per status)
Todo: ${Overall Execution Status.TODO.Percentage}% (Overall Execution Status.TODO.Count})
Fail: ${Overall Execution Status.FAIL.Percentage}% (Overall Execution Status.FAIL.Count})
Pass: ${Overall Execution Status.PASS.Percentage}% (Overall Execution Status.PASS.Count})
Executing: ${Overall Execution Status.EXECUTING.Percentage}% (Overall Execution Status.EXECUTING.Count})
Aborted: ${Overall Execution Status.ABORTED.Percentage}% (Overall Execution Status.ABORTED.Count}) |
Now, with this new notation, you are able to get the percentage and the number of tests per status. Some improvements were done in order to reduce the document generation time and to avoid affecting Jira performance. |
|
General Improvements and bug fixes
Small improvements and bugs were also solved.
New Features and Bug Fixes
...