Currently, Microsoft Word Charts aren't supported by Xporter for Jira for third-party limitations.
To export charts on a Microsoft Word template, you need to use Object Linking and Embedding (OLE) Microsoft Excel Chart. This chart can be inserted via Insert -> Object -> Microsoft Excel Chart.
This will insert an embedded Excel book in your document, where the first sheet is a chart and the second sheet contains its data. You can export number fields from Jira to this second sheet to populate the chart.
Example 1
Export three number custom fields (NumberA, NumberB, NumberC) from a single issue and compare them in a chart.
After inserting the Microsoft Excel Chart, change the chart data as shown below:
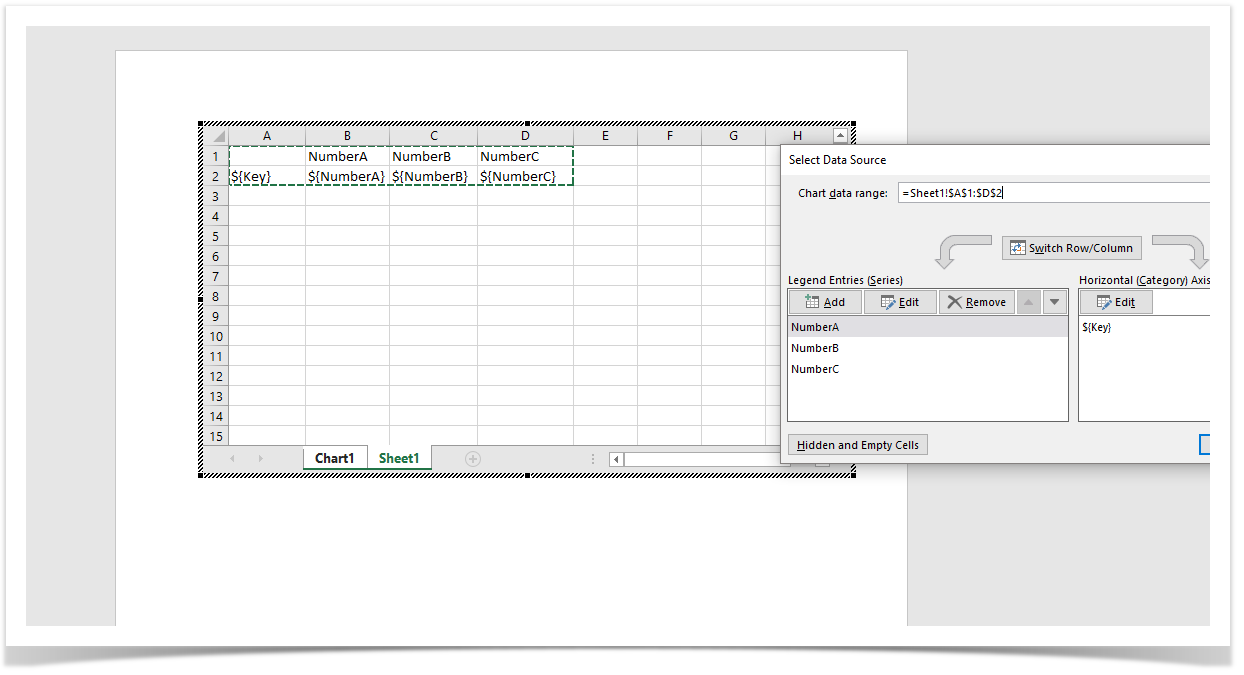
Note: It's important to go to Hidden and Empty Cells and change the Show empty cells as: option to "Zero". This will safeguard issues with no value defined on the fields.
Save and upload the template to Xporter for Jira. Export it on a single issue or Bulk.
Example 2
Export a number of issues and their information. At the end of the report, present a chart with the sum of the number custom fields.
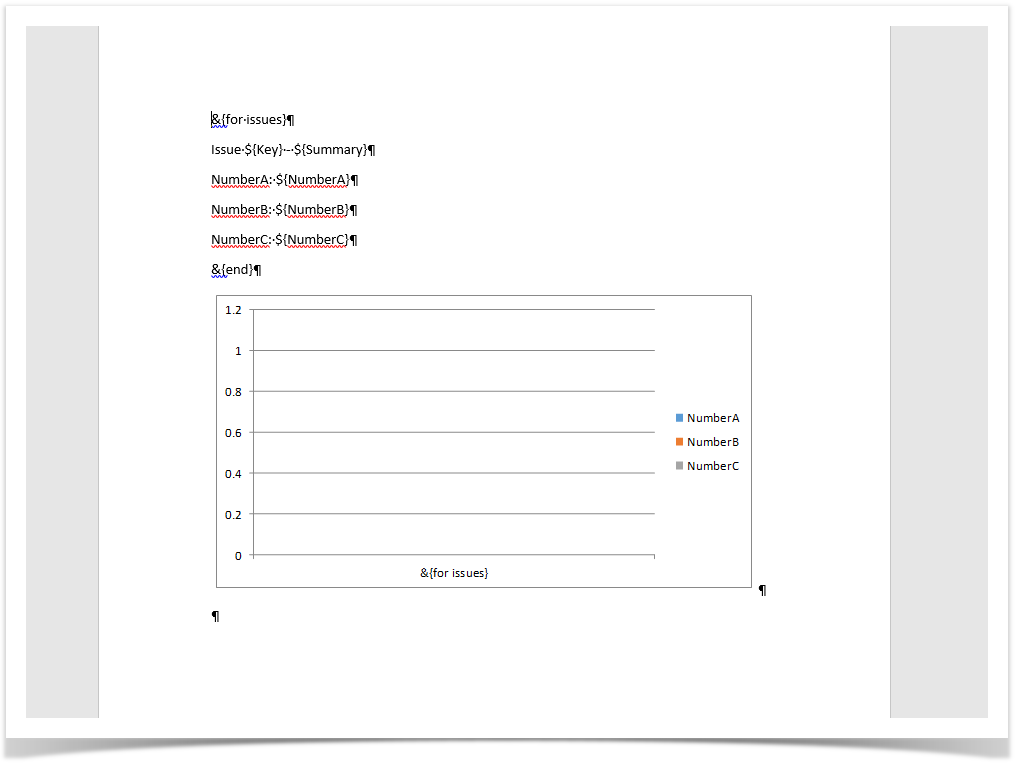
Start by initializing a variable to each series on the chart. In a for issues block, all desired issue information will be exported and the issue values to the previously defined variables will be added.
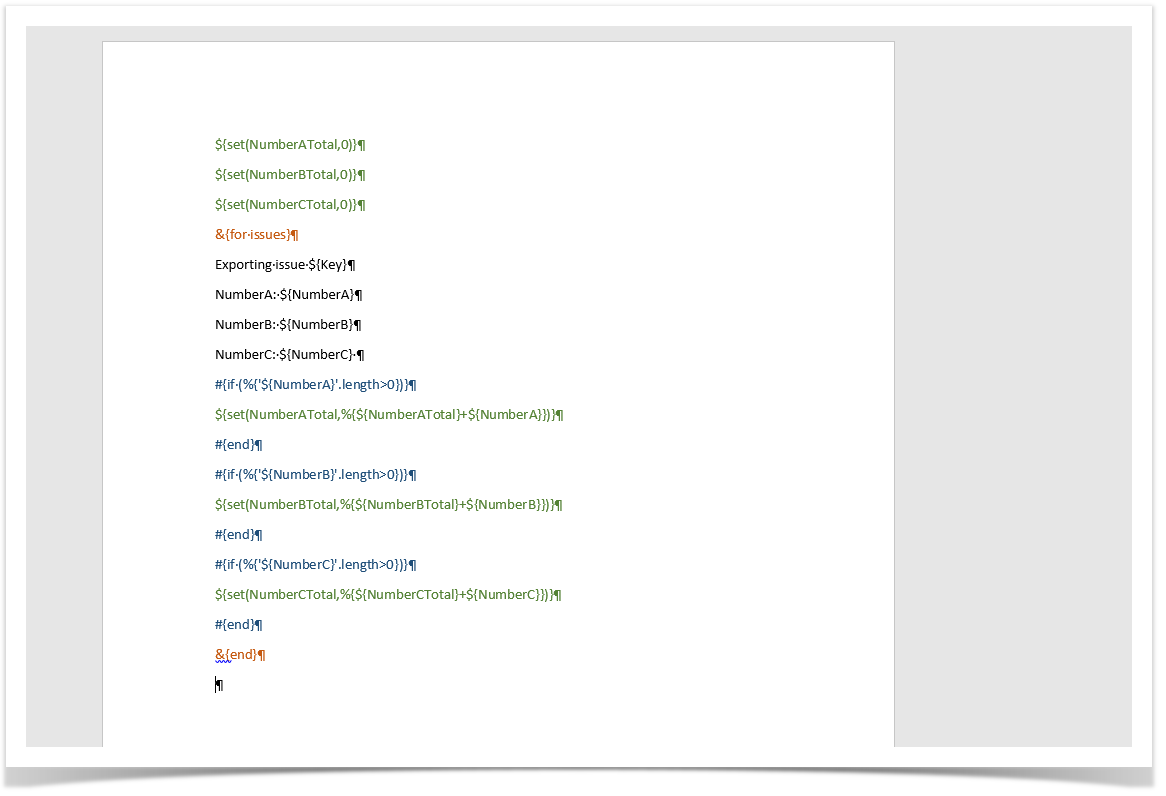
At the end of the document, add a chart as in the previous example, but with the newly defined variables.
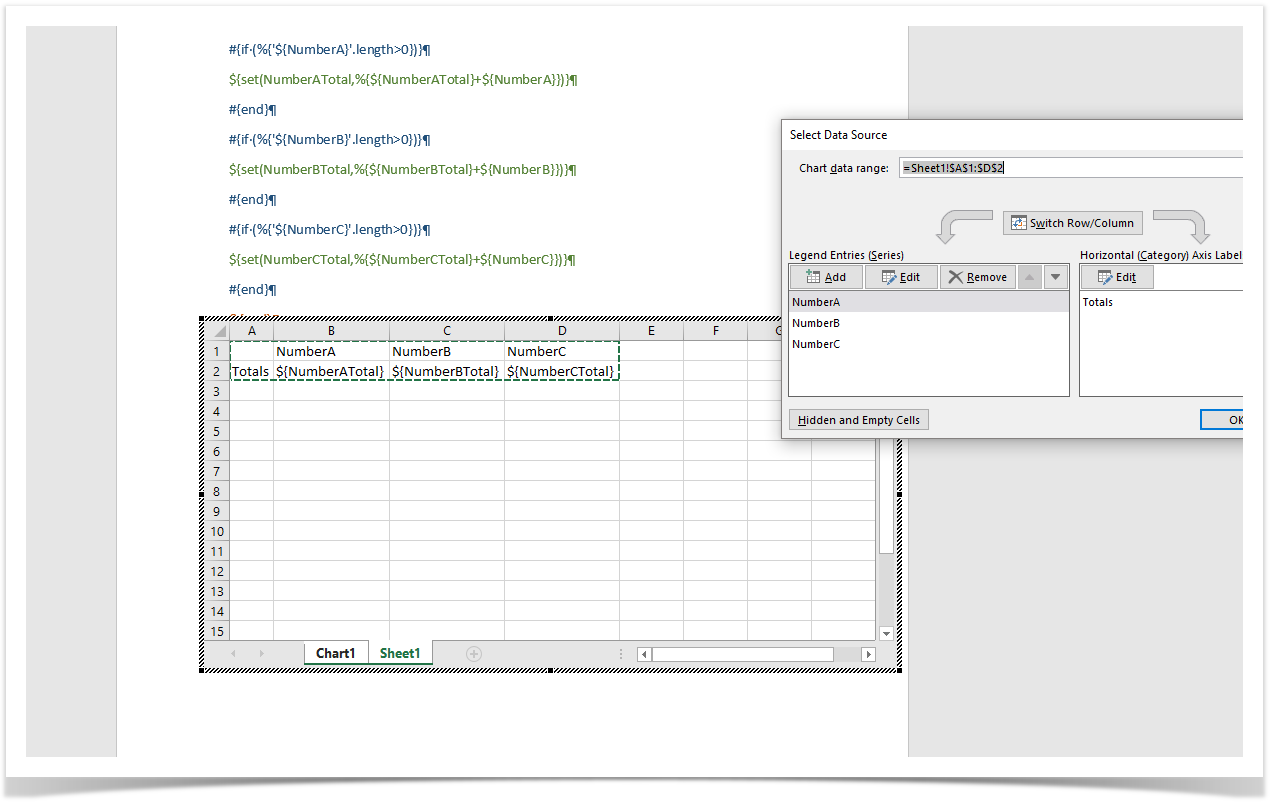
Save and upload the template to Xporter for Jira. Export it in Bulk.
| Resources: |
|---|
| Template |
| Bulk exportation |
Example 3
Use a Microsoft Excel Chart inside an iteration.
You can use a chart inside an iteration. You can export information about an issue, iterate all its linked issues or subtasks, and present a chart for each iteration.
The context passed to the chart is the same logic as in all iterations.
Using a set function as in the previous example, we can use a final chart to compare totals of links with totals of subtasks.
Example 4
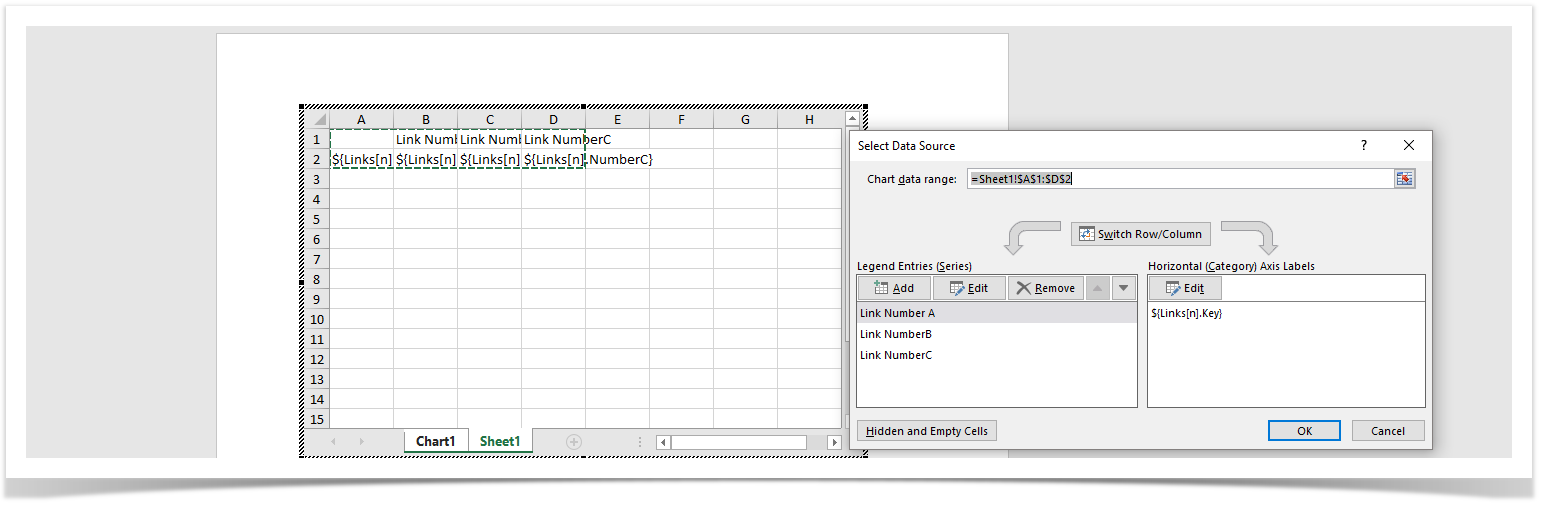
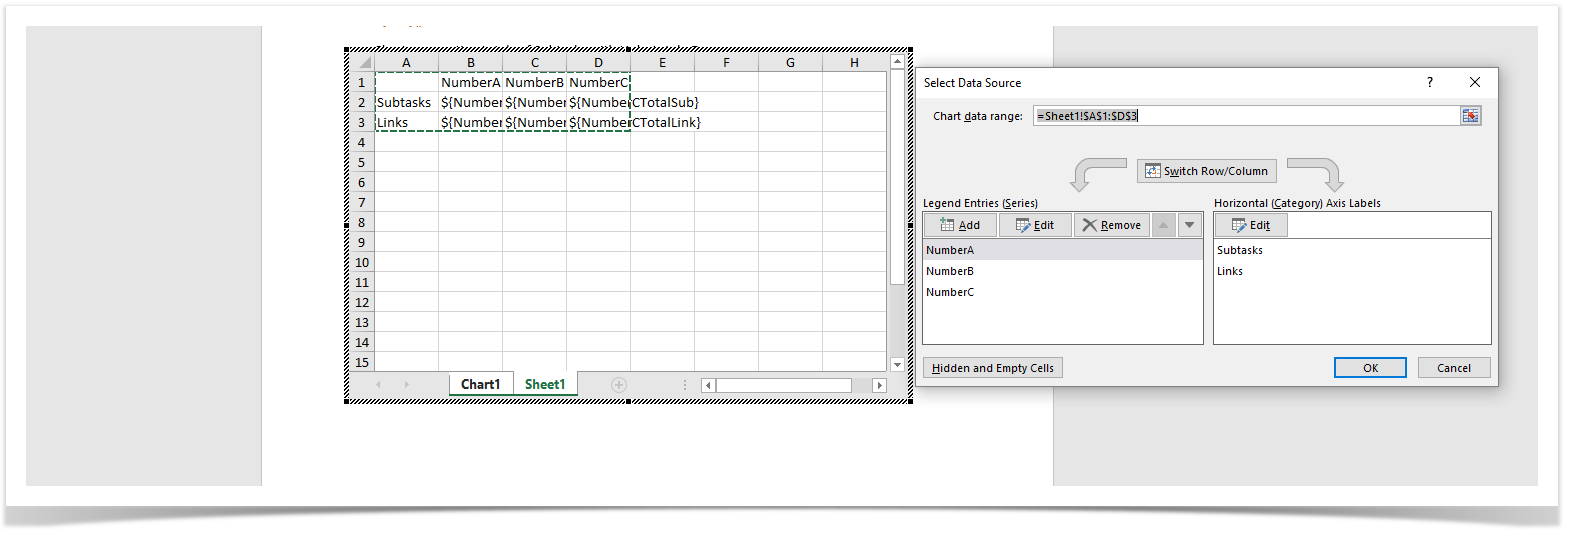
You can pass all issues context to a Microsoft Excel Chart using a for issues inside its data sheet.
In order to construct this type of chart (with for issues). you need to set its series and category values manually. Refer to the Guide.
| Resources: |
|---|
| Template |
| Bulk exportation |